Analytics and Reporting That Tells You Exactly Where Your Revenue Is Coming From
Built for businesses in India, UK, UAE, and USA that want to stop guessing which marketing channels work and start making every budget and growth decision from real data.
Three Analytics Services. One Revenue Intelligence System.
Select a service area to see what each layer delivers. Every engagement covers all three because dashboards, analytics, and automation compound in value when integrated.
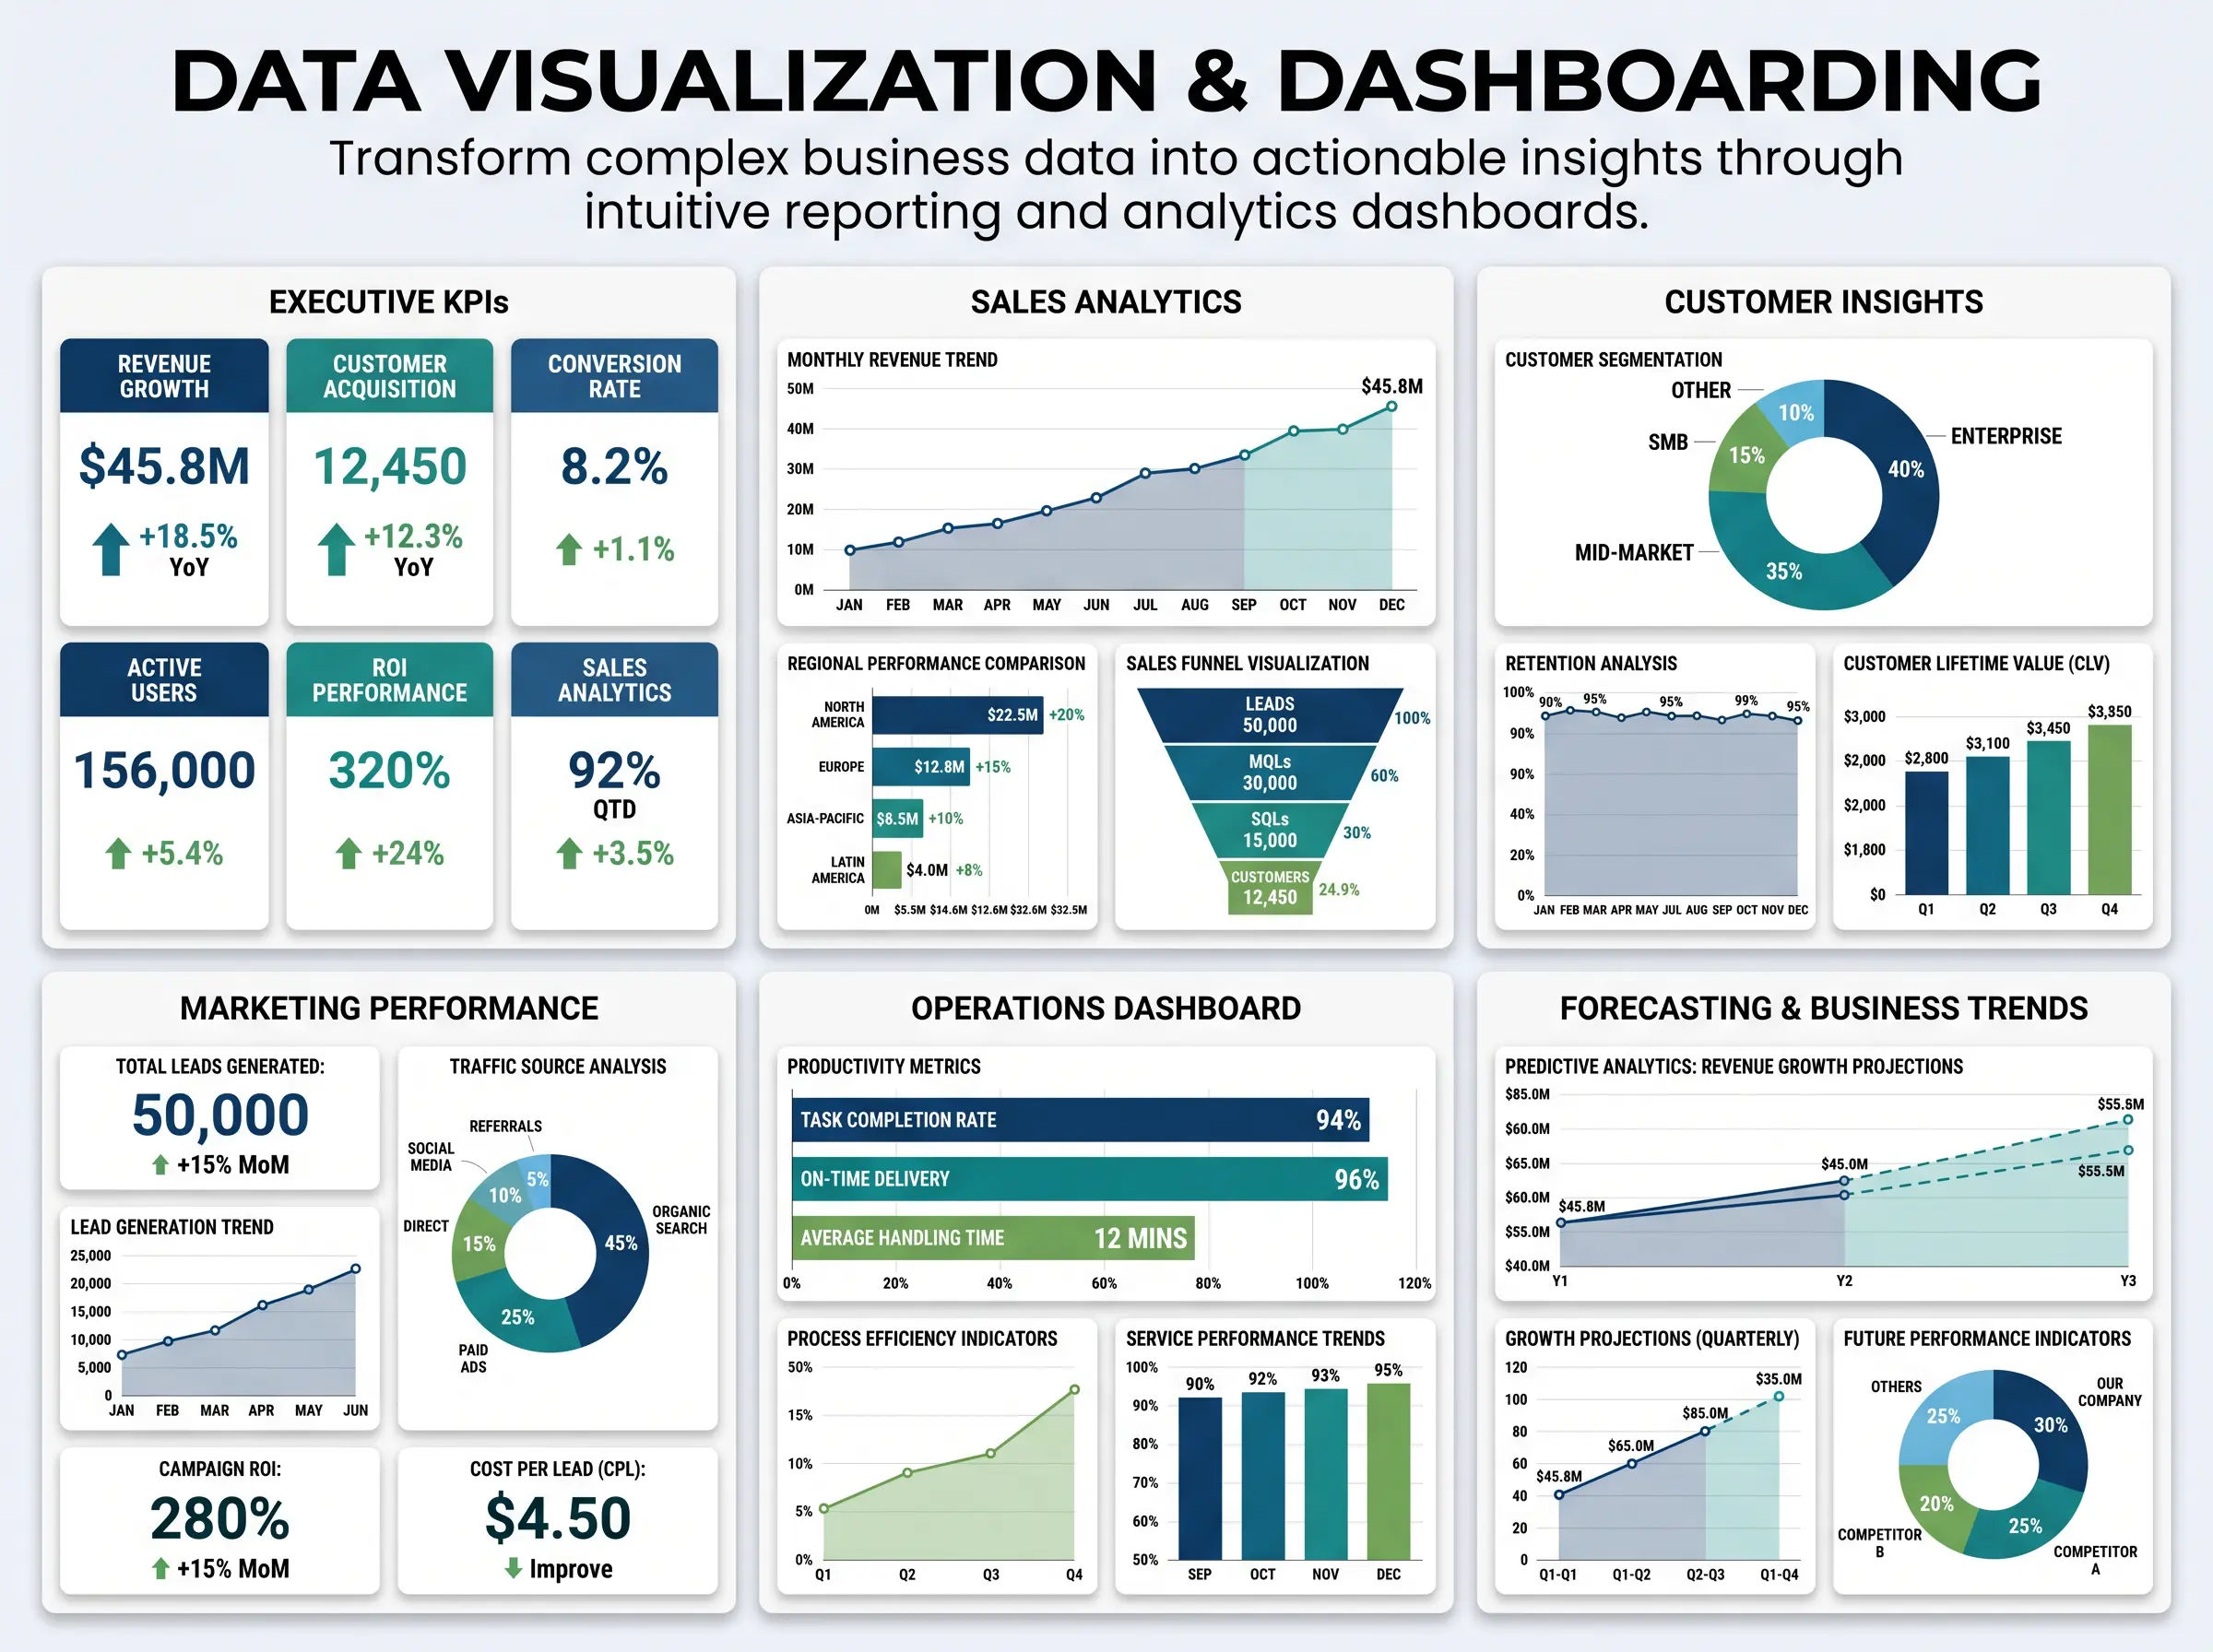
Data Visualisation and Dashboarding
A dashboard is only as valuable as the decisions it enables. We build decision-support systems that show the specific metrics each stakeholder needs to make the next best decision, updated automatically, with no manual data preparation required.
- ✦Stakeholder requirements mapping - every decision-maker, every metric they need
- ✦Cross-platform attribution connecting ad spend to CRM deal data and revenue
- ✦Executive summary to campaign-level drill-down in one dashboard hierarchy
- ✦Looker Studio, Power BI, and Tableau builds with branded design and automated refresh
- ✦Full documentation - every metric definition, data source, and filter logic explained
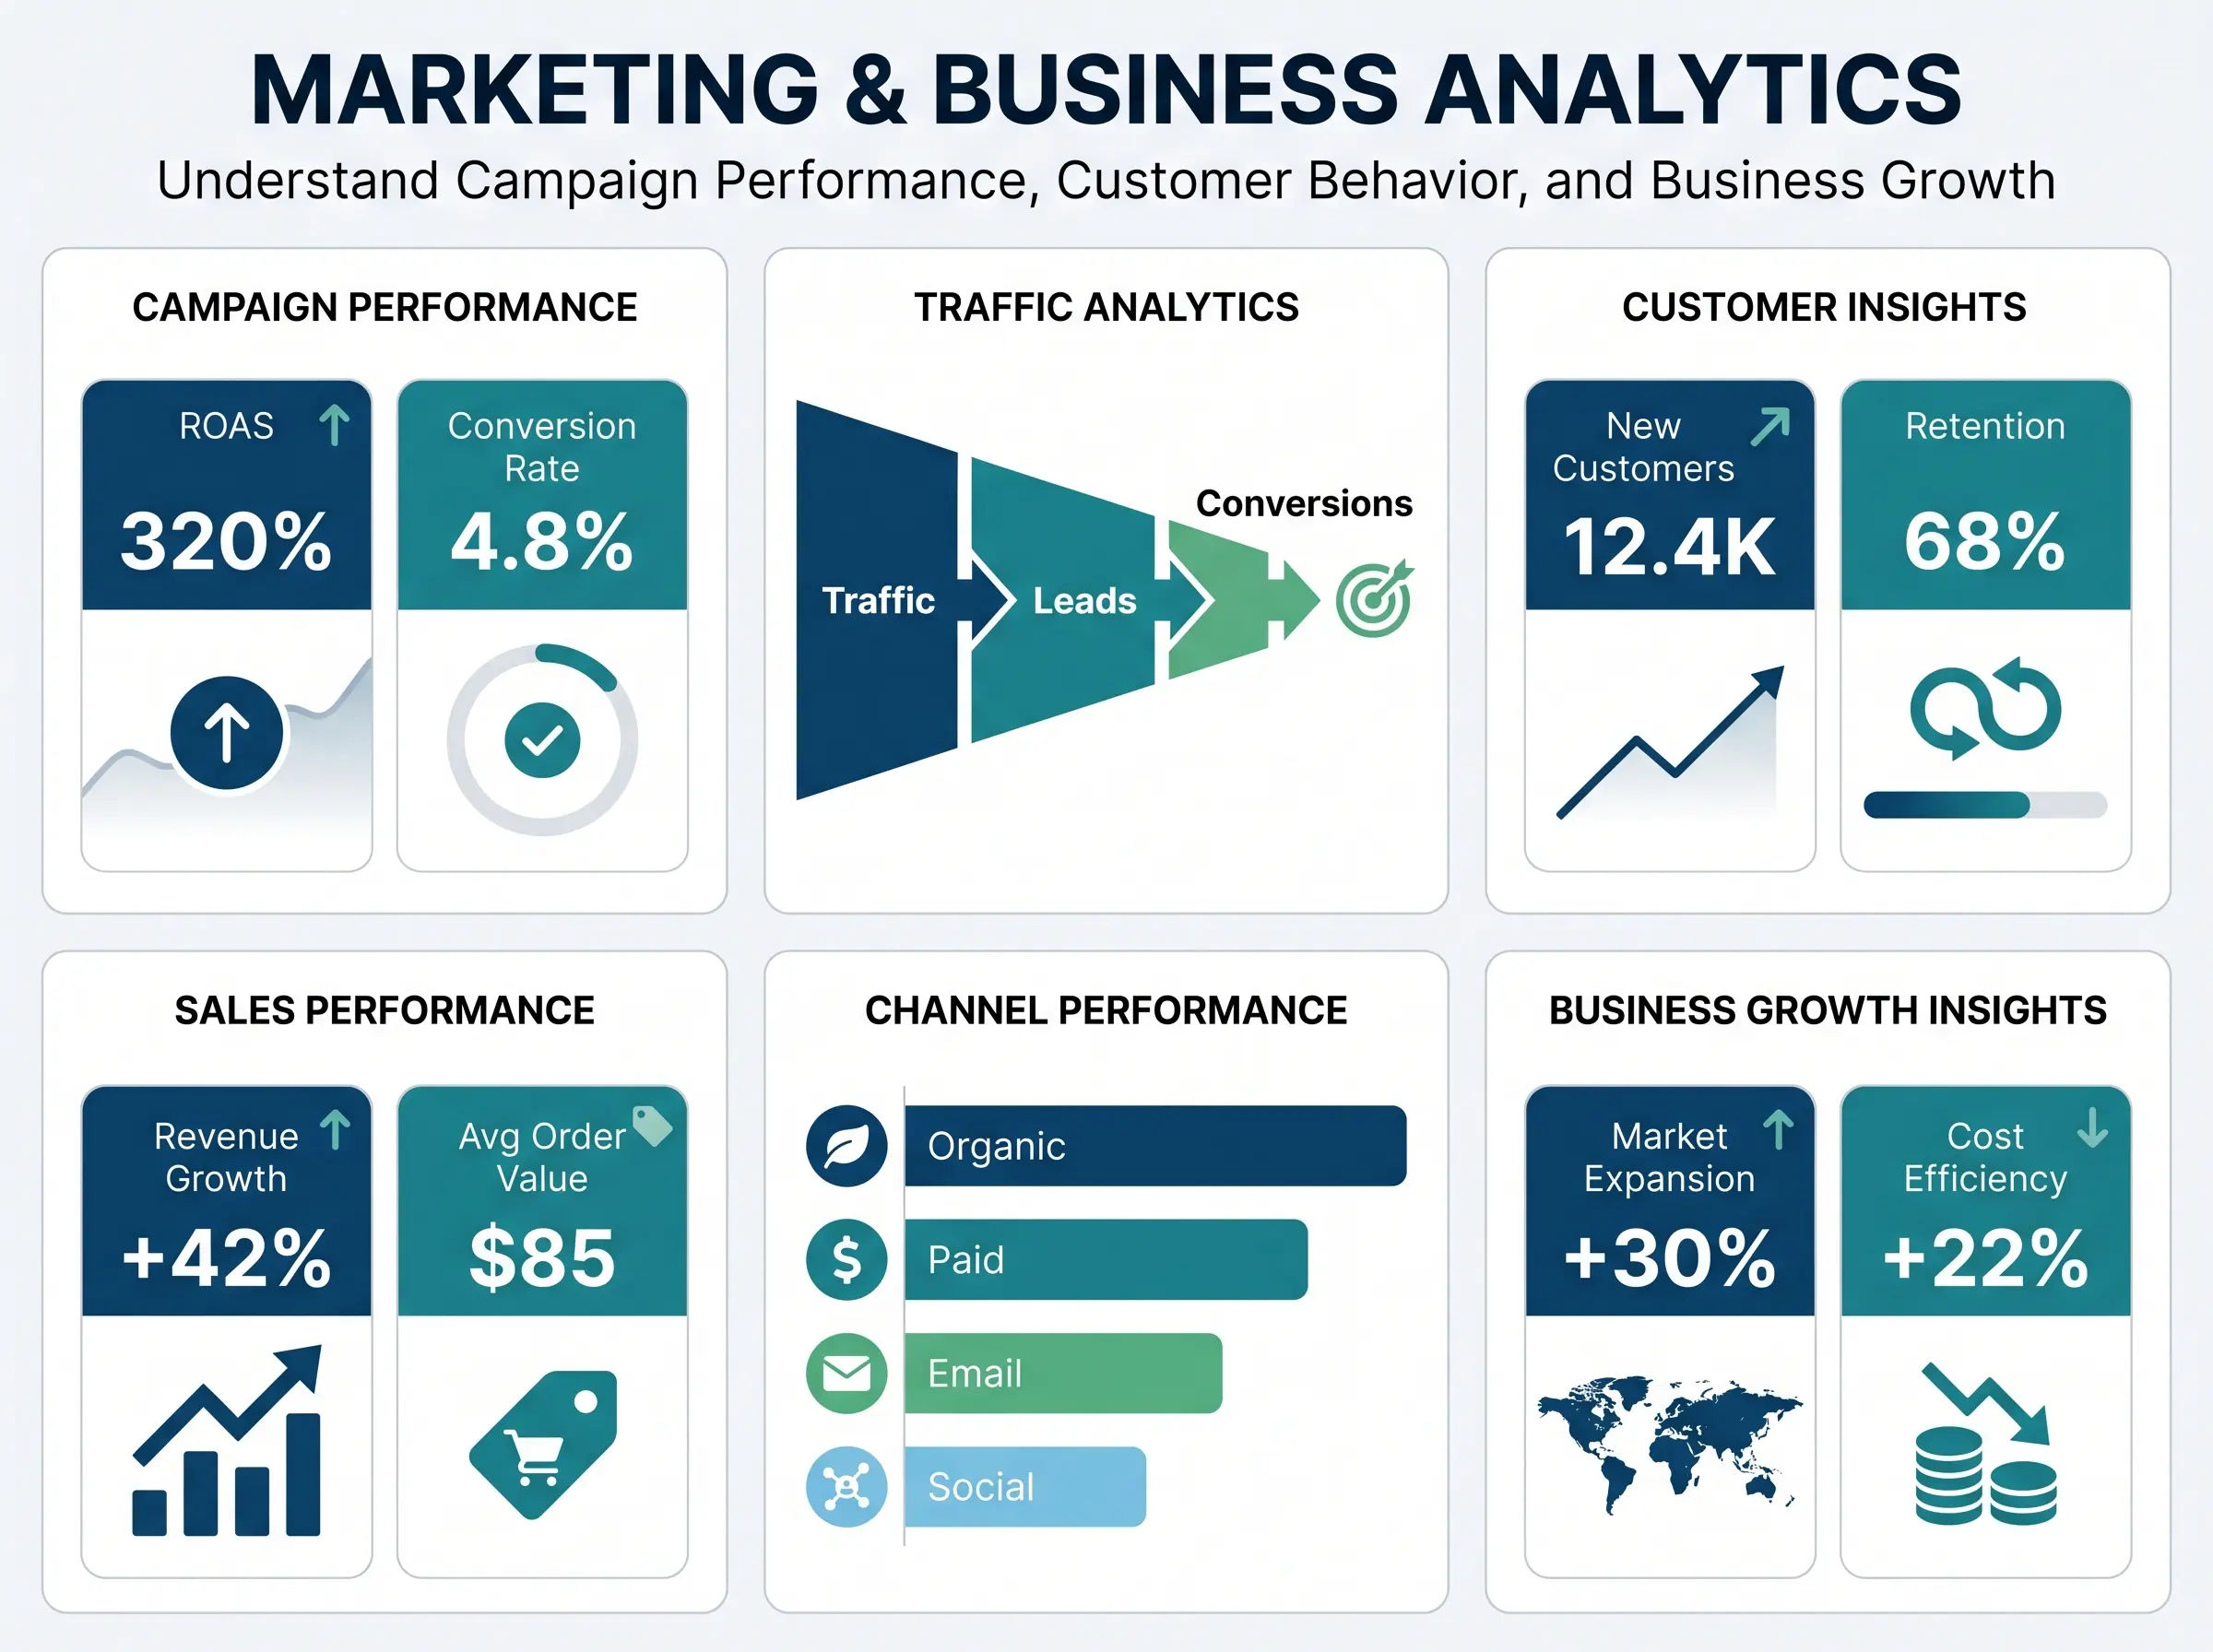
Marketing and Business Analytics
Data without analysis is noise. We build marketing and business analytics programmes that identify which channels produce the best return, where your funnel loses qualified buyers, and which customer segments are worth the most over their lifetime.
- ✦Multi-touch attribution allocating revenue credit across every marketing touchpoint
- ✦True CAC including agency fees, ad spend, content, and tool costs - not just platform spend
- ✦Full-funnel conversion mapping from first visit to closed deal - find where qualified buyers exit
- ✦Customer lifetime value modelling by acquisition channel, product line, and segment
- ✦Cohort analysis, churn prediction, and audience segmentation for recurring revenue businesses
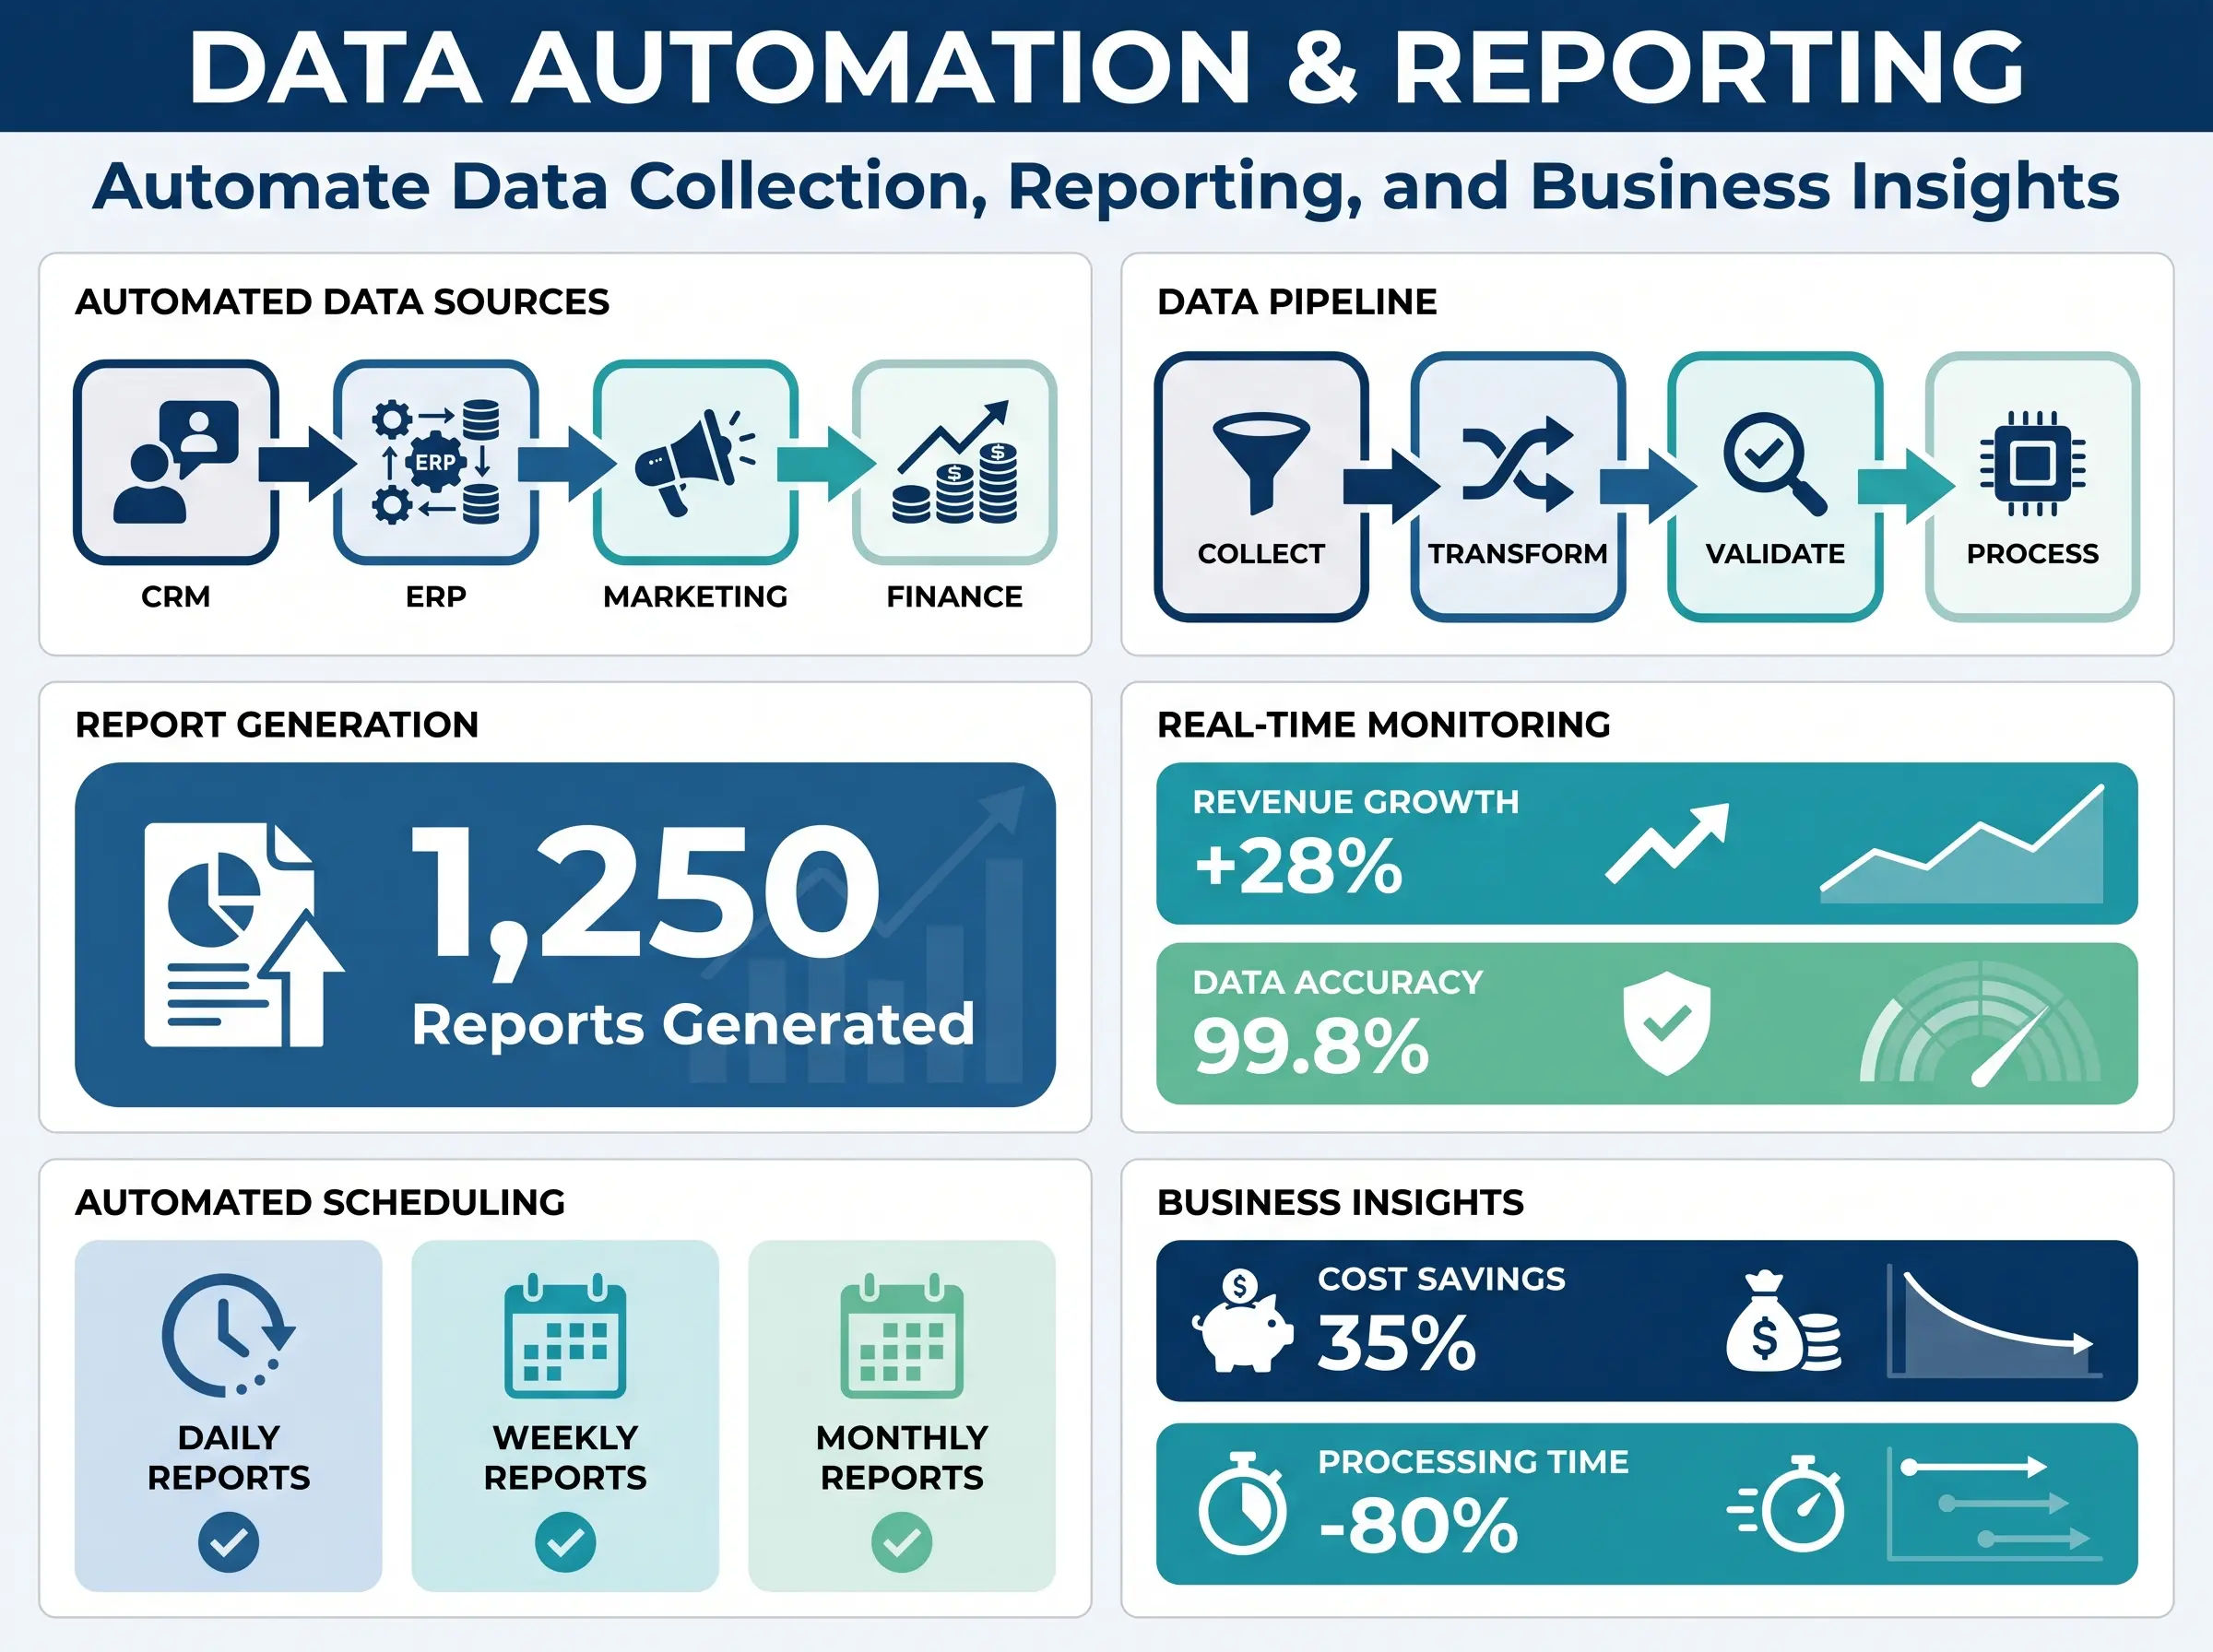
Data Automation and Reporting
Every repeatable report your business produces on a weekly, monthly, or quarterly cycle is a candidate for automation. We build the infrastructure that delivers accurate, formatted, revenue-connected reports to every stakeholder on time, every time, without anyone touching a spreadsheet.
- ✦Python scripts pulling every ad platform and CRM API on schedule - zero manual export
- ✦SQL query library and ETL pipelines keeping dashboards current without intervention
- ✦Excel Power Query automation transforming existing workflows into one-click refreshes
- ✦Data validation and anomaly alerts flagging errors before reports are delivered
- ✦Stakeholder-specific report versions delivered to every inbox before Monday morning
Analytics That Connect Data to Revenue Decisions
Every analytics system connects your marketing spend to revenue outcome, replaces manual reporting with automation, and gives every stakeholder the metrics they need to make the next best decision.
Power BI · Tableau · Looker Studio - Connected to Your Data Sources
Enterprise dashboarding platforms configured for your specific data sources, stakeholder hierarchy, and refresh requirements. Not generic templates - decision-support systems built around your actual metrics and the revenue outcomes each decision-maker needs to track.
Multi-Touch Revenue Attribution
Revenue credit allocated across every marketing touchpoint from first awareness to conversion. True channel ROI - not last-click attribution that systematically overstates paid performance and undercounts organic.
GDPR · CCPA · India DPDP
Analytics systems built to meet data protection requirements in every market we serve - GA4 consent mode, IP anonymisation, data retention policies, and GDPR-compliant data processing agreements for every analytics tool.
Automated Report Delivery
Python automation delivers formatted reports to every stakeholder inbox on schedule - zero manual export, zero manual formatting, every Monday morning before they arrive at work.
How We Build Your Analytics and Reporting System
Every engagement follows this six-step process, delivering first working dashboards within 48 hours for clean data sources and a fully integrated analytics system within 30 to 60 days.
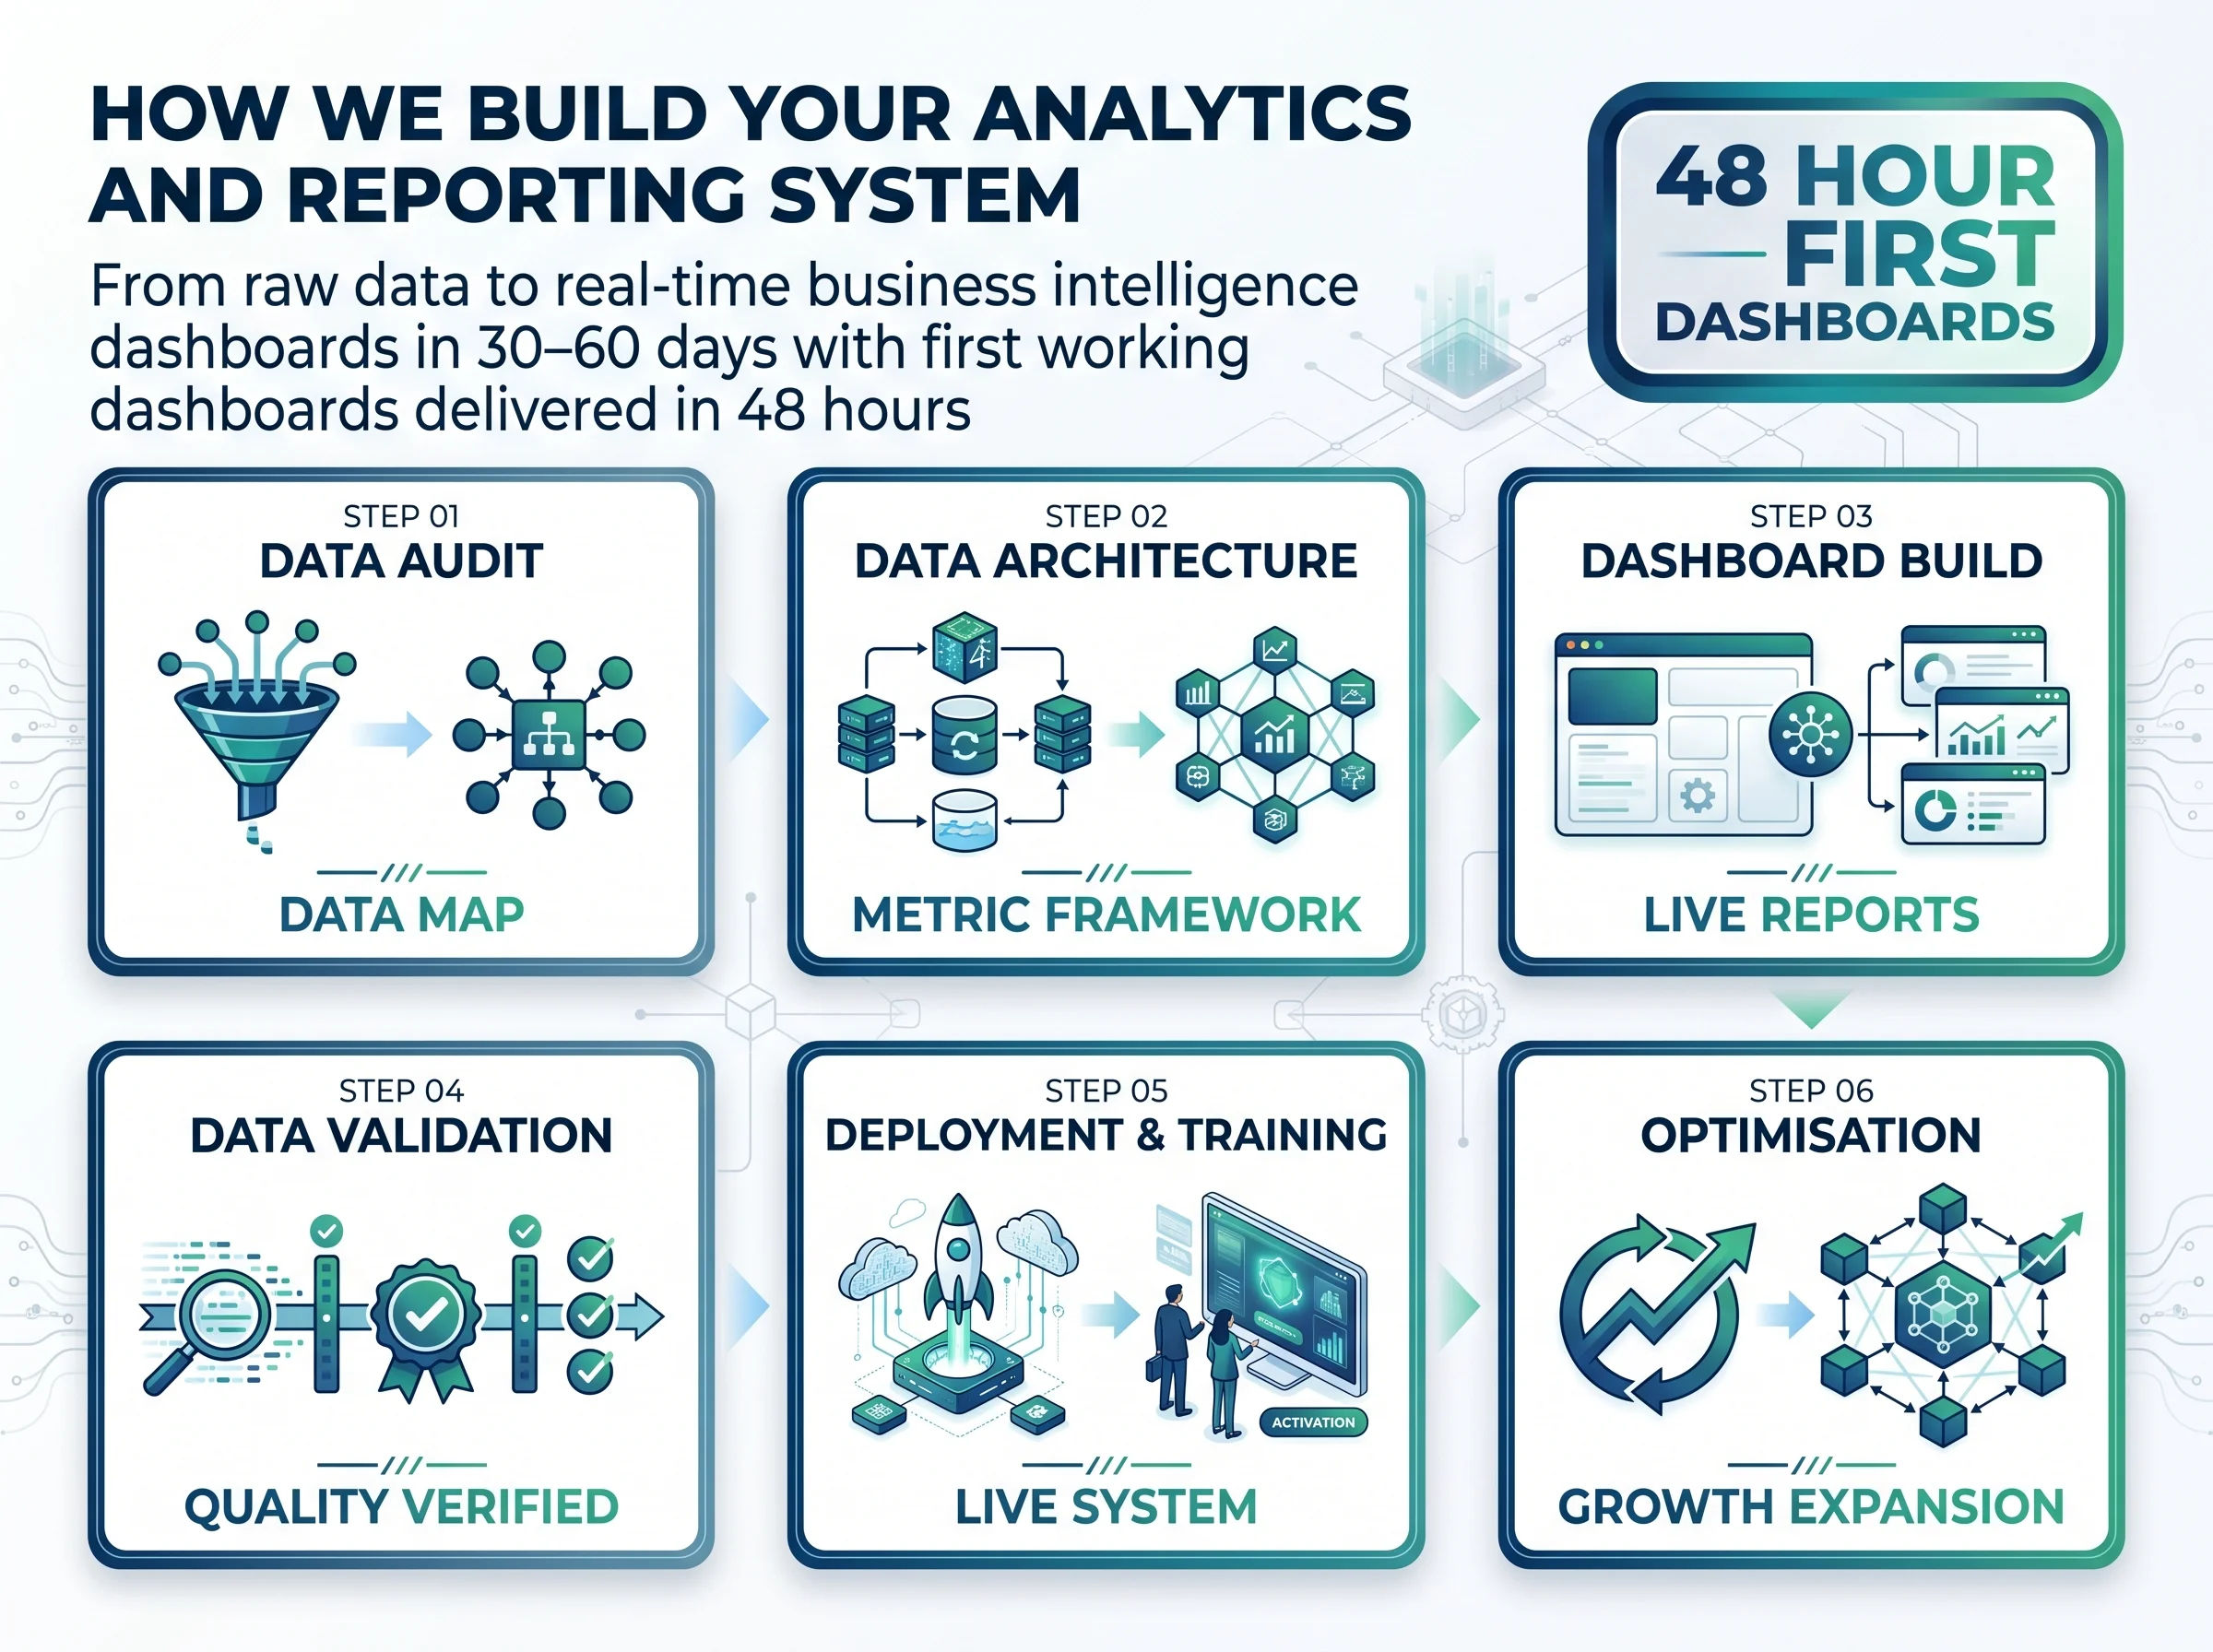
Data Audit & Requirements Discovery
Map every data source, assess quality and connection availability, and conduct stakeholder interviews to identify which decisions each person needs data to support.
Data Architecture & Connection Design
Design the data layer, define the attribution model that accurately allocates revenue across channels, and establish metric definitions applied consistently across every report.
Dashboard & Report Build
Build dashboards in Power BI, Tableau, or Looker Studio and automated report pipelines in Python, SQL, and Excel Power Query. Every build includes connections, calculated fields, filter logic, and branded design.
Data Validation & Quality Assurance
Test every conversation flow, workflow branch, and exception condition - accuracy benchmarking and edge-case coverage before any live deployment.
Live Deployment & Stakeholder Training
Deploy dashboards to production, connect live sources, schedule all automated report delivery, and train every stakeholder on reading, filtering, and interpreting their dashboard view.
Optimisation & Expansion
Monthly review of dashboard usage, metric accuracy, and stakeholder feedback. Identify next highest-value analytics expansion as your business grows and data sources change.
From Data Audit to Live Dashboard in 48 Hours
Three steps. No long procurement cycles. No open-ended pilots. A defined engagement with a defined output at each stage - first working dashboard within 48 hours for clean data sources, full analytics system within 30 days.
Book a Free Data Audit
A 30-minute call with our analytics team. We review your current data sources, identify which dashboard or automation delivers the highest value for your specific situation, and outline what a connected analytics system looks like for your business.
Receive Your Analytics Blueprint
Full technical specification delivered within 3 business days - data source connections, dashboard architecture, metric definitions, attribution model design, and automated reporting schedule. You approve before any build begins.
First Dashboard Live in 48 Hours
First working dashboard live within 48 hours for clean data sources. Full analytics system - dashboards, automation pipelines, and scheduled reporting - delivered within 30 days with complete documentation and stakeholder training.
Platforms We Build Your Analytics Stack On
Every tool chosen for your specific data sources, team capability, and reporting requirements. No proprietary lock-in - your dashboards and data pipelines remain yours.



Ready to Build an Analytics System That Tells You Exactly Where Your Revenue Is Coming From?
Most businesses across India, UK, UAE, and USA are making marketing budget decisions based on platform-reported metrics that have no direct relationship to revenue, compiling reports manually that could be automated, and operating without a unified view of which channels generate their best customers. Before you make another budget decision on incomplete data or spend another week compiling a report manually, book a free data audit with MarTech Union. In 30 minutes we will review your current data sources, identify the highest-value dashboard or automation for your specific situation, and show you exactly what a connected analytics system looks like for your business. No pitch decks. No generic demos. A specific plan built around your data and your decisions.
Serving businesses across India, USA, UAE and the UK · Free discovery call · No commitment required
Got Questions?
We Have Answers.
Everything you need to know about our Data Visualisation Dashboards, Marketing Analytics, and Reporting Automation services for businesses across India, UK, USA & UAE.